HIGHLIGHTS
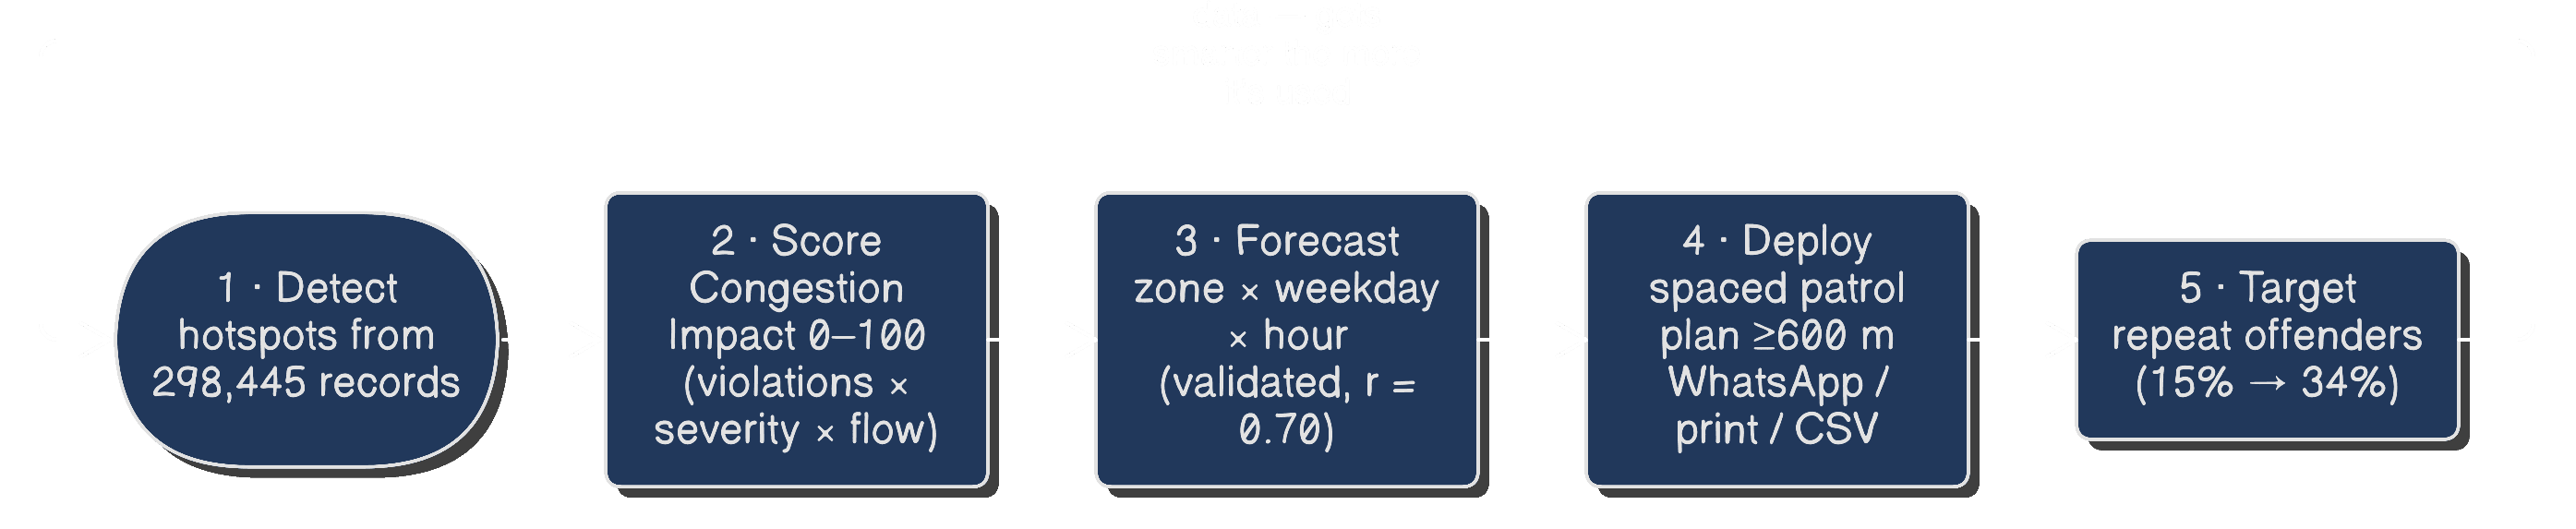
Detect, score, forecast, deploy: a closed loop that ends in a patrol plan a supervisor can brief at tomorrow’s roll call.
Engineer, team of three - Data pipeline, forecasting, patrol optimizer, API and both apps (every commit in the repo)
Python · pandas / numpy · LightGBM
FastAPI on Render · Next.js 16 + deck.gl on Vercel
Gemini 2.5 Flash with function calling
Round 1: 26 May – 7 June 2026
Round 2 prototype: 17–23 June 2026
Source on GitHub
Flipkart’s Gridlock Hackathon 2.0 ran in two rounds. Round 1 was a machine-learning challenge: forecast a city’s traffic demand. Clearing it put our team into Round 2, a prototype round on real Bengaluru traffic problems, judged by Bengaluru Traffic Police and Flipkart.
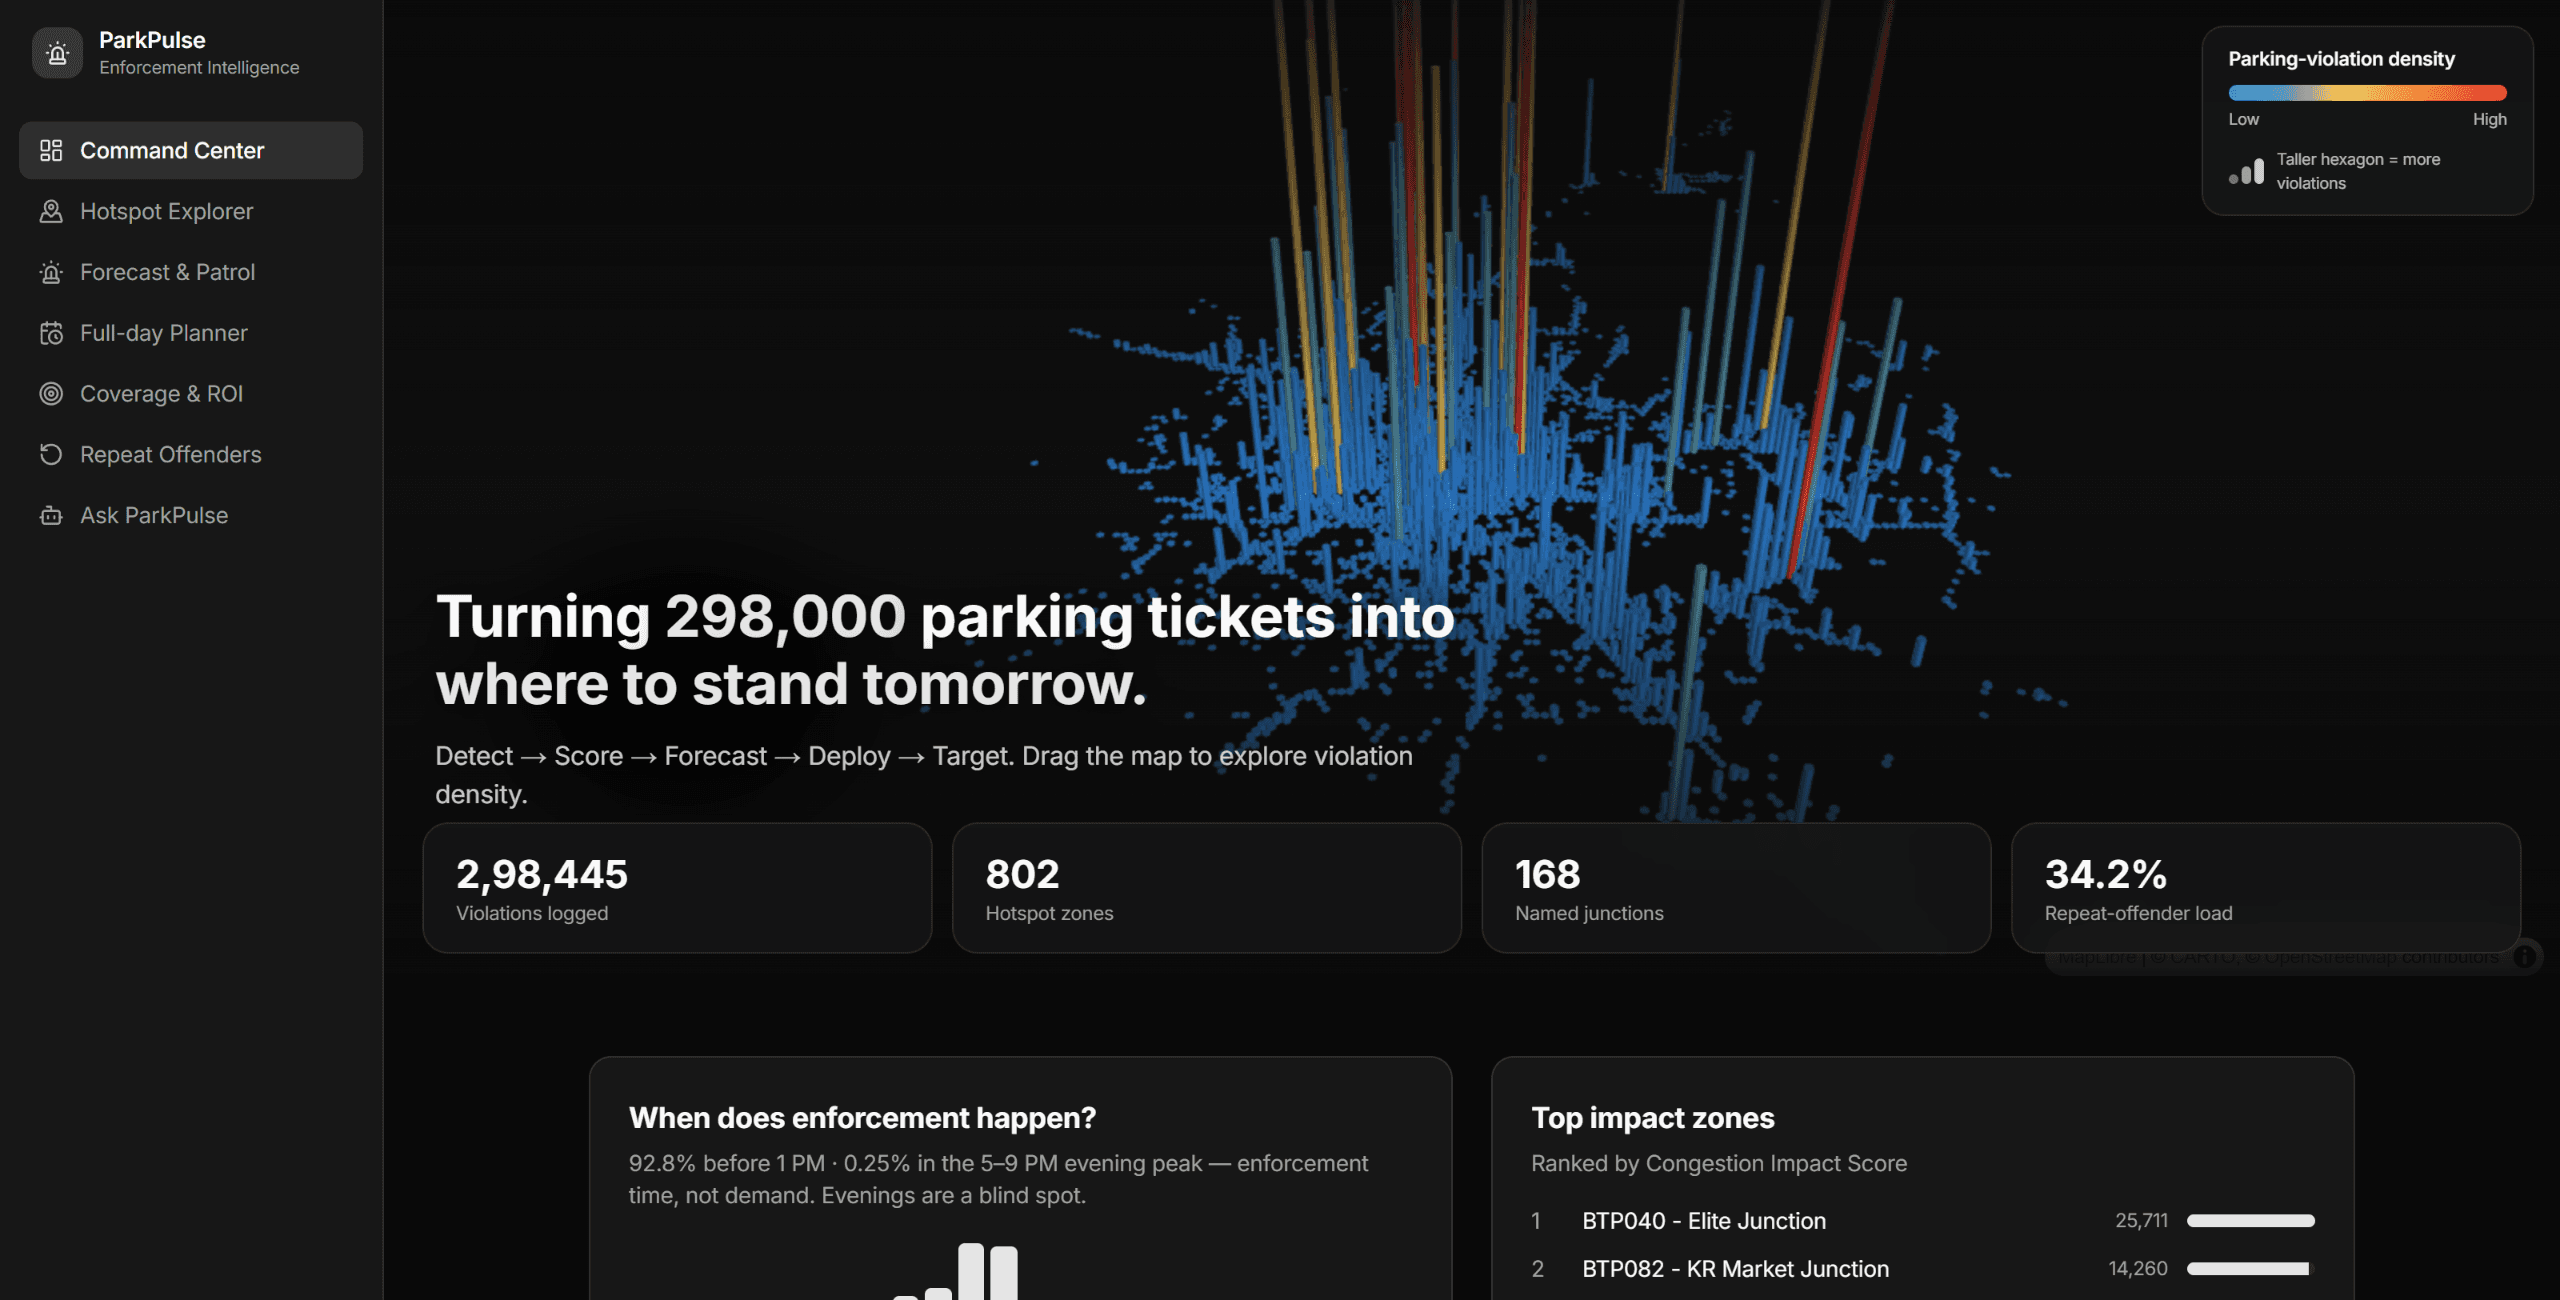
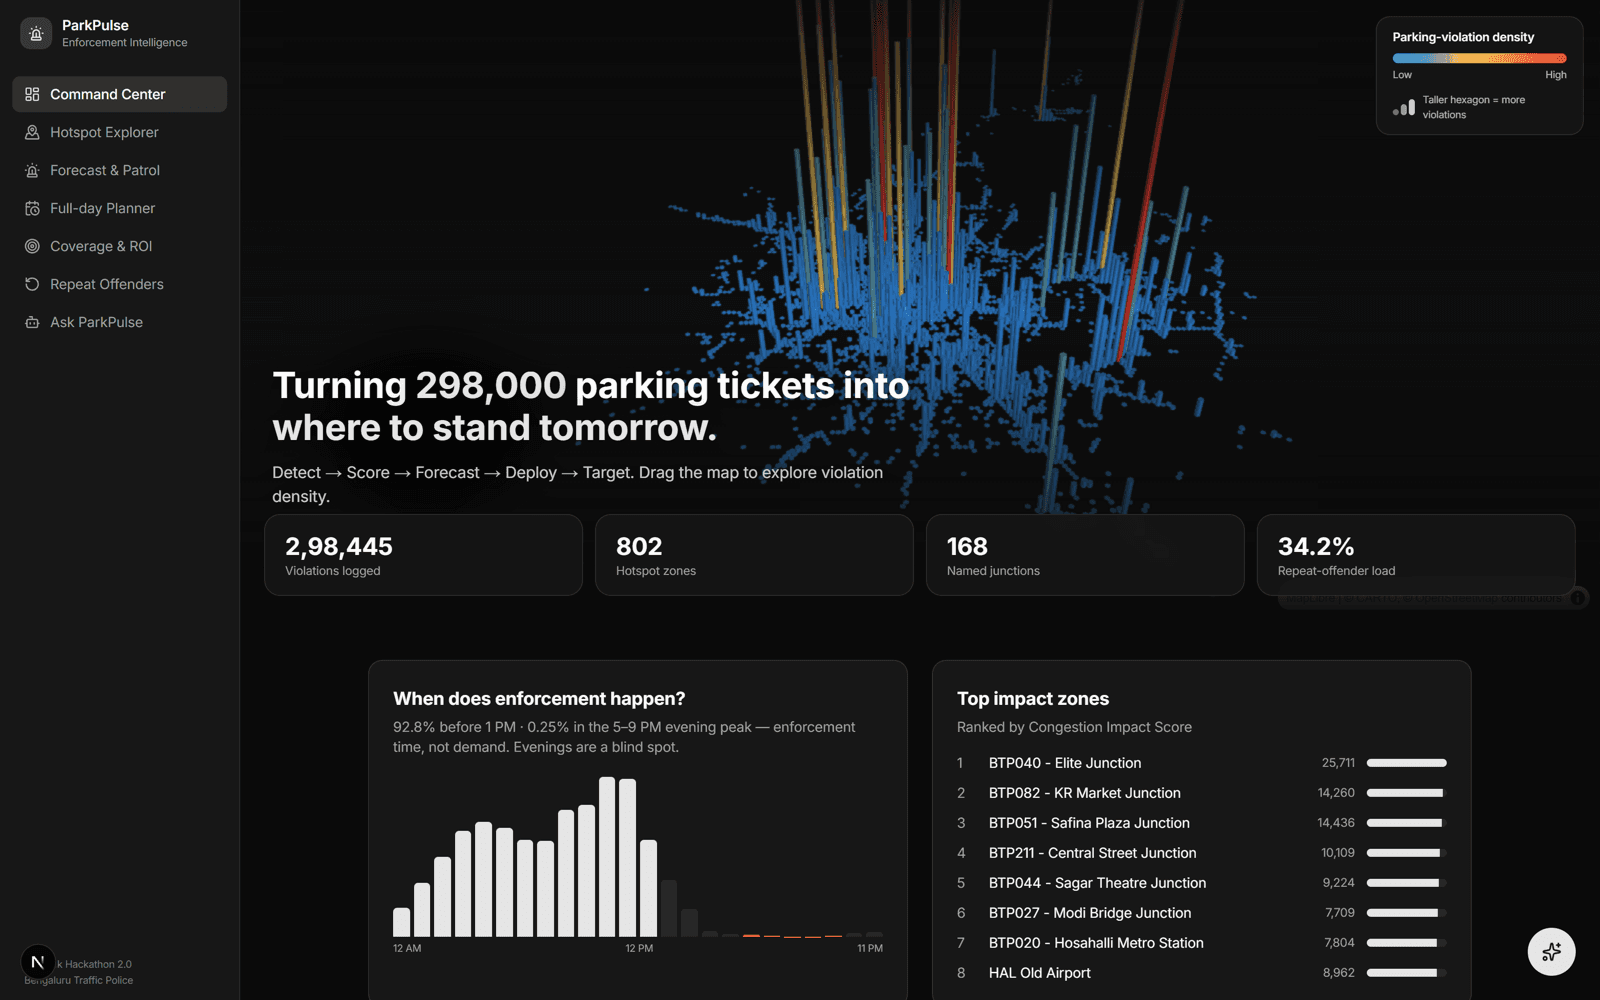
We picked parking-induced congestion. ParkPulse turns 298,445 parking-violation records into answers a traffic supervisor can act on: where illegal parking chokes traffic, when it recurs, and where to send a limited number of patrol teams tomorrow.
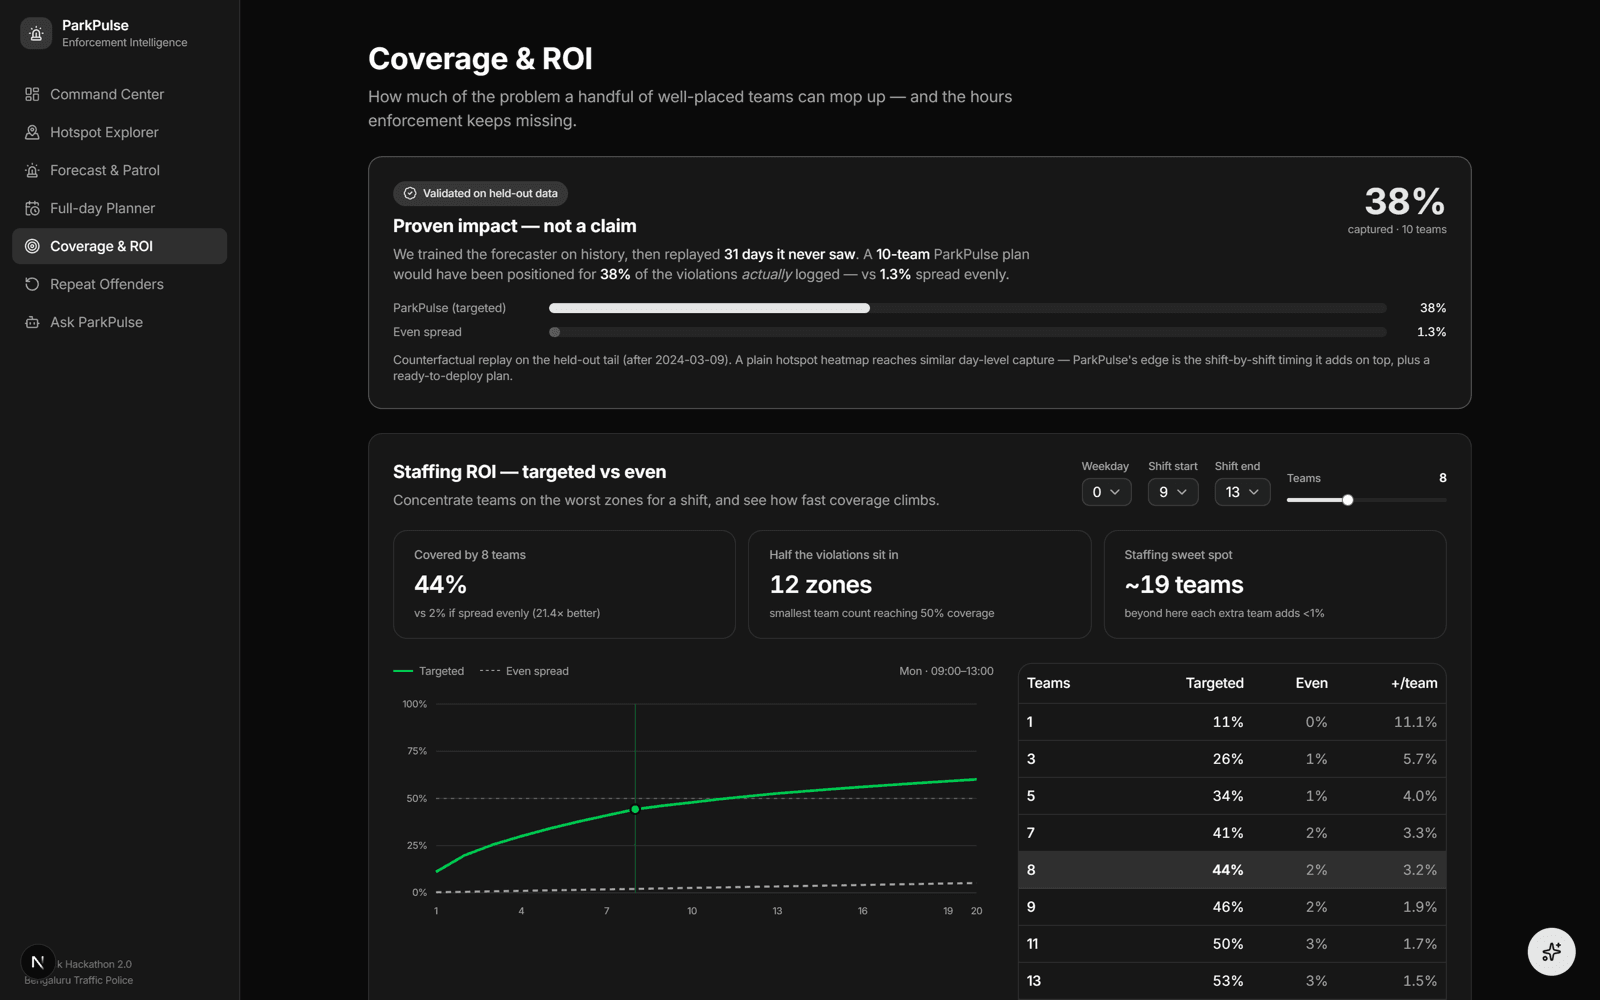
On 31 days the model never saw, a 10-team ParkPulse plan would have been standing where about 38% of the logged violations happened, against about 1.3% for teams spread evenly.
The task looked like regression: 77,299 labelled rows of location, time and road features, scored on R². The split said otherwise. Training labels covered one full day plus the first two hours of the next; the test was the rest of that second day.
So it was a forecasting problem in disguise: given yesterday and this morning, predict this afternoon. The strongest signals were the place, the time of day, and the same place at the same time yesterday.
Only one direction was clean: yesterday predicting today. For today’s rows, every history feature came from the full previous day. For yesterday’s rows, location averages came from the other folds, so no row ever saw its own target. The day itself was dropped as a feature, because today’s labelled rows were all quiet early morning.

LightGBM on raw demand was the main model, with log-target LightGBM, XGBoost and CatBoost for diversity, plus two deterministic anchors so tree models couldn’t cap the midday peaks. A non-negative least-squares blend combined them.
Honest 5-fold out-of-fold validation scored R² 0.957, against 0.656 for a per-location average baseline. The team cleared Round 1 and was shortlisted for the prototype round.
Illegal parking near markets and junctions narrows roads and builds congestion, and enforcement teams have no city-wide view of where it matters most. The data was 150 days of Bengaluru Traffic Police e-challan records: location, time, violation type, vehicle and police station.

Tight hotspots. The top 1% of roughly 100-metre cells hold 33% of all violations.

A chronic minority. 15.3% of vehicles account for 34.2% of violations.

A morning-only record. About 93% of tickets are written before 1 PM, and under 0.3% in the 5–9 PM evening peak.

A hundred footpath tickets matter less to traffic than a hundred cars blocking a main road at a junction. Each violation type gets a flow-severity weight, from 1.0 for parking on a main road down to 0.1 for a defective number plate.
Records are grouped into about 800 neighbourhood zones by geohash. A zone’s Congestion Impact Score multiplies volume, average severity and how much of it sits at junctions or on main roads, then log-scales it to 0–100 so a few mega-hotspots don’t flatten every other zone.
Patrols need a forecast per zone, weekday and hour, but with only about 21 of each weekday in 150 days, most of those cells are sparse and noisy.
The forecaster uses empirical-Bayes shrinkage: each weekday-specific rate is pulled toward the zone’s overall profile for that hour, with a strength of 12 pseudo-observations. A data-rich cell keeps its own estimate; a sparse one leans on the stable average.

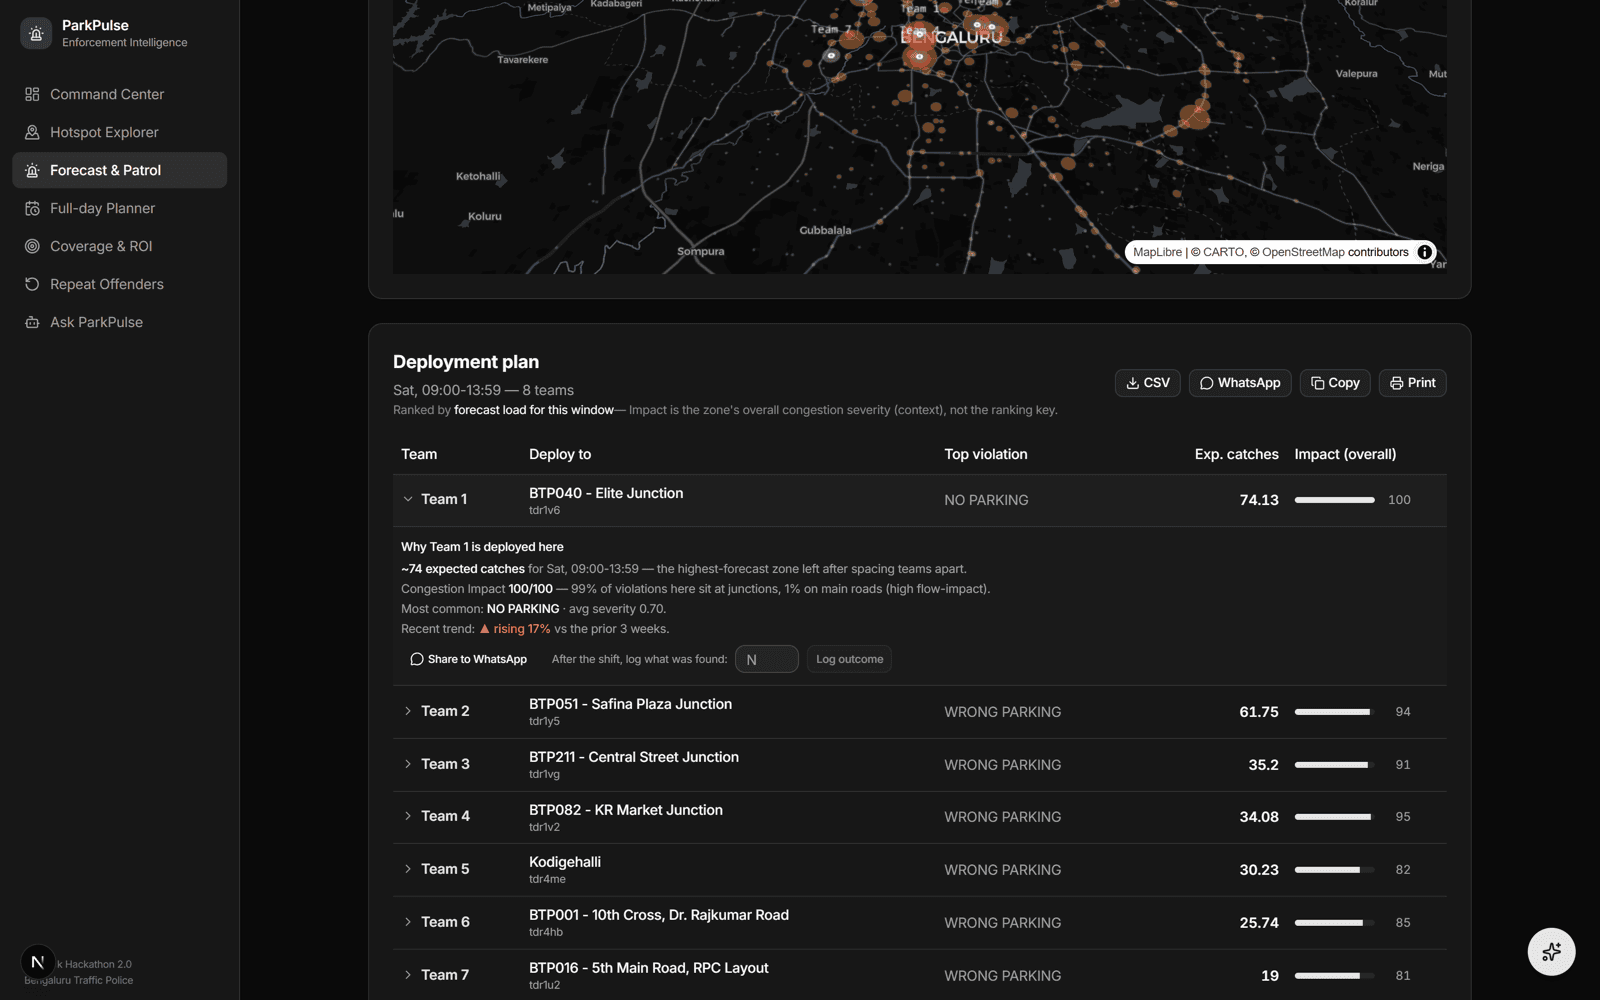
Sending K teams to the K busiest zones fails: the hottest zones cluster on the same road. The optimizer walks zones in order of forecast load and accepts one only if it is at least 600 metres from every zone already chosen.
It’s instant, fully explainable, and every team gets a “why here?” panel. Plans export to CSV, print, or WhatsApp.
Asking for “6 teams on Friday evening near KR Market” returned one team. The planner only considered zones with a forecast for that window, and only about 15 zones city-wide had any logged evening violations.
The fix kept every nearby zone as a candidate and ranked by impact where the forecast was empty, since evenings are sparse precisely because they’re under-enforced. Then the co-pilot was taught to say so: when most placed teams sit on near-zero zones, it names the blind spot and recommends the efficient team count instead of presenting six teams as equally useful.
The forecaster trained on the first 80% of the calendar and predicted the rest. Result: Pearson r = 0.70, mean absolute error 2.01 violations per cell.
That’s moderate on purpose. The held-out tail has only about four of each weekday, and ticket-writing carries real randomness. A score near 0.99 here would have meant leakage.
It measures enforcement efficiency on logged violations, not true parking demand. And against a plain static heatmap, day-level capture is roughly tied. ParkPulse’s edge is the shift-by-shift timing, the ready-to-deploy plan and the co-pilot, so that’s how the pitch framed it.
All the intelligence lives in one pandas/numpy module with no UI dependency. Running it on its own builds the zones, runs the backtest and prints a sample plan, which is how the model was validated before a single map rendered.
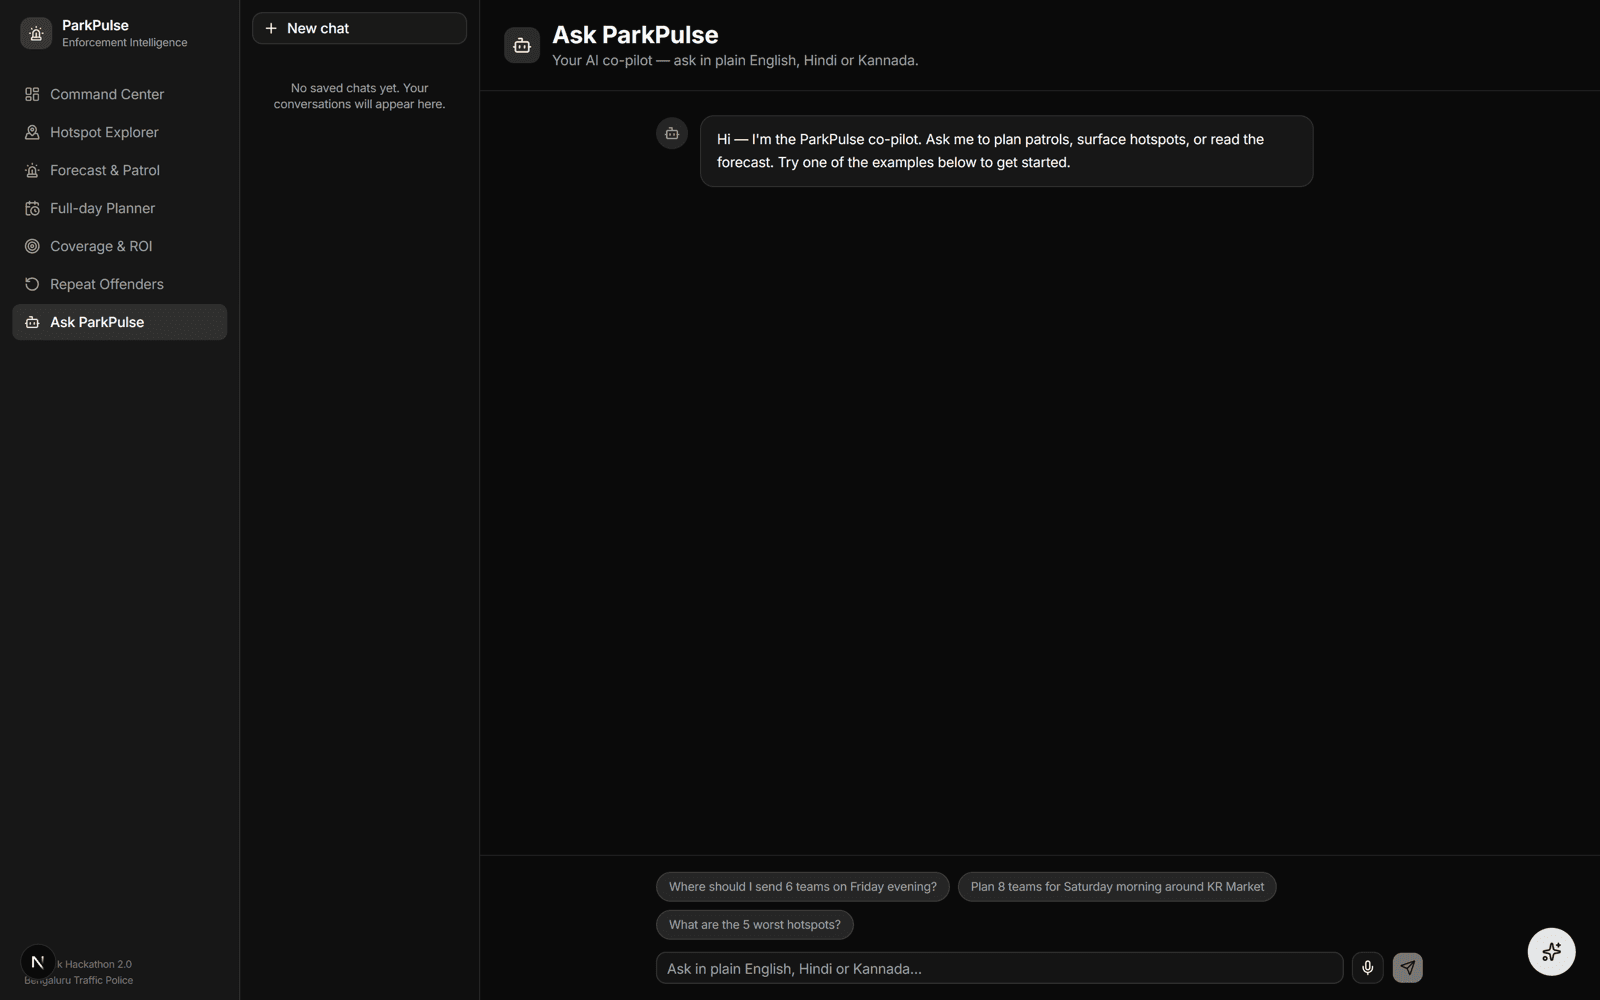
Two apps import that same module: a Streamlit prototype for the submission, and a FastAPI backend behind a Next.js 16 and deck.gl frontend for the finale-grade build.
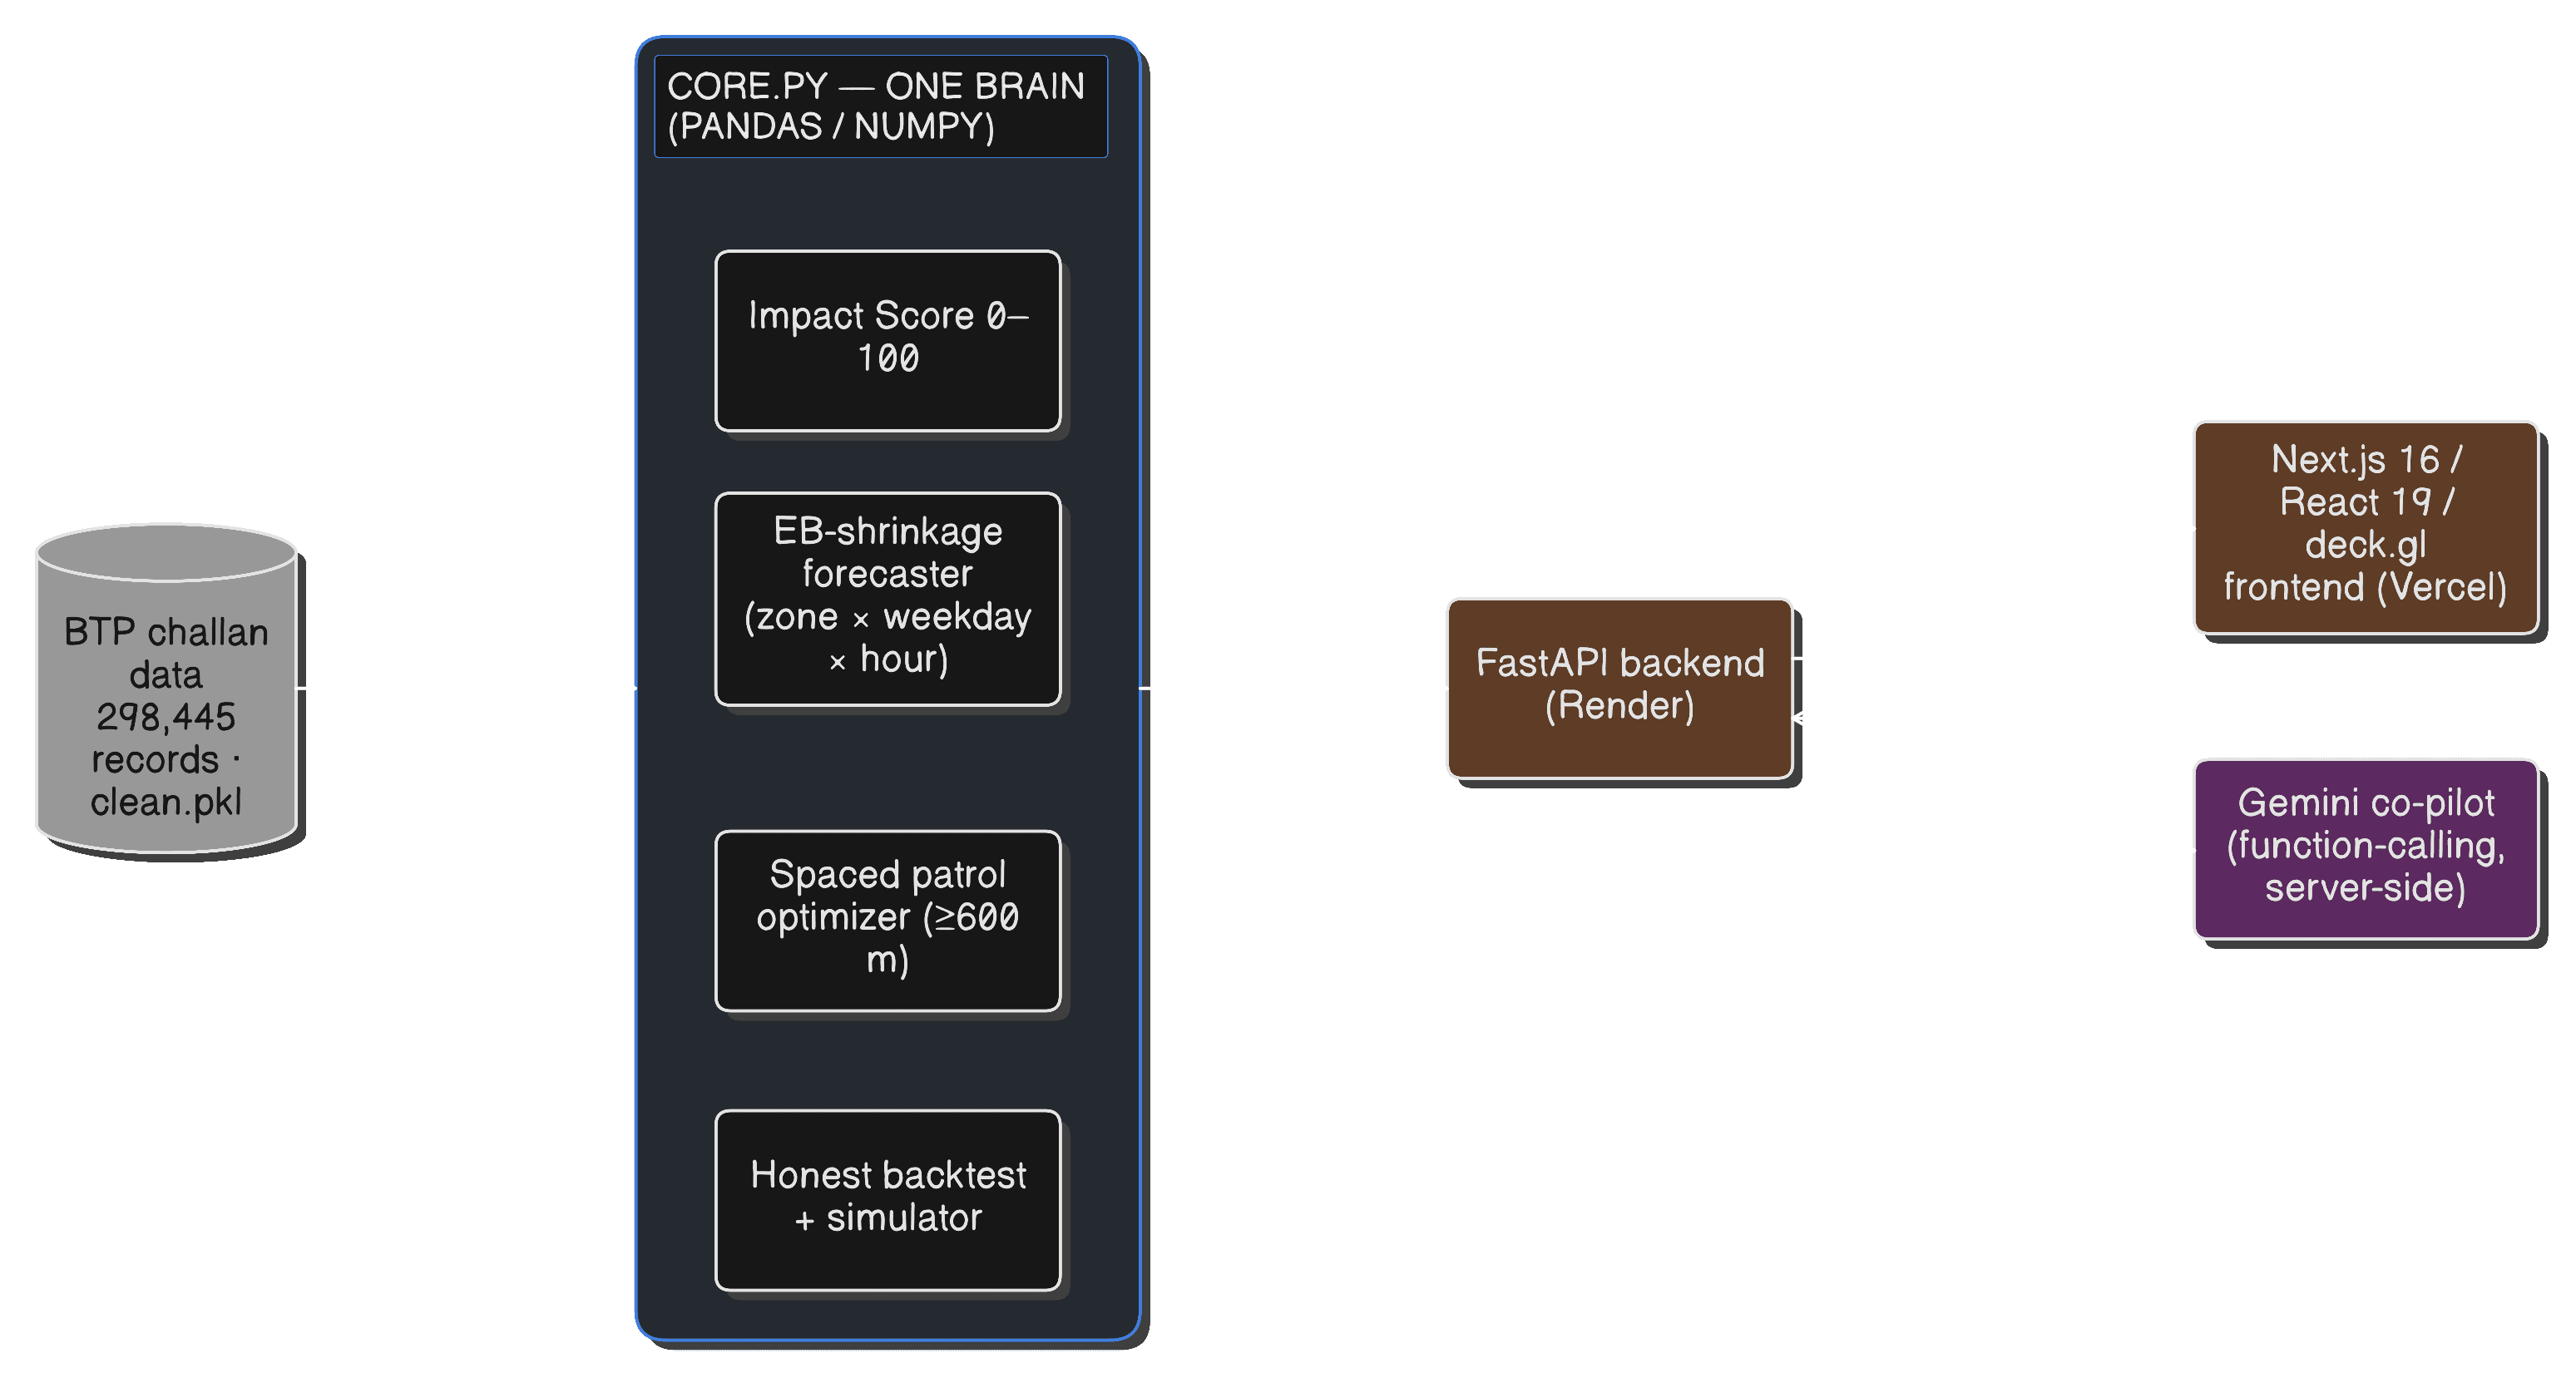
The co-pilot is Gemini 2.5 Flash with function calling over four tools: make a patrol plan, list top hotspots, coverage stats and repeat offenders. It doesn’t generate numbers; it calls the same code as the dashboard and explains the result, including when a request can’t be met.